
























GA4
pushes you to ask harder, more honest questions about your audience.
The shift to an event-based model changes your mindset as much as your tools. Instead of patting yourself on the back for a traffic spike, you start paying attention to what people actually do on your site. Did they watch the video? Did they drop off before checkout? Did they ever return? Those are the numbers worth your attention, because they are the ones that grow your business.
The problem with most analytics dashboards
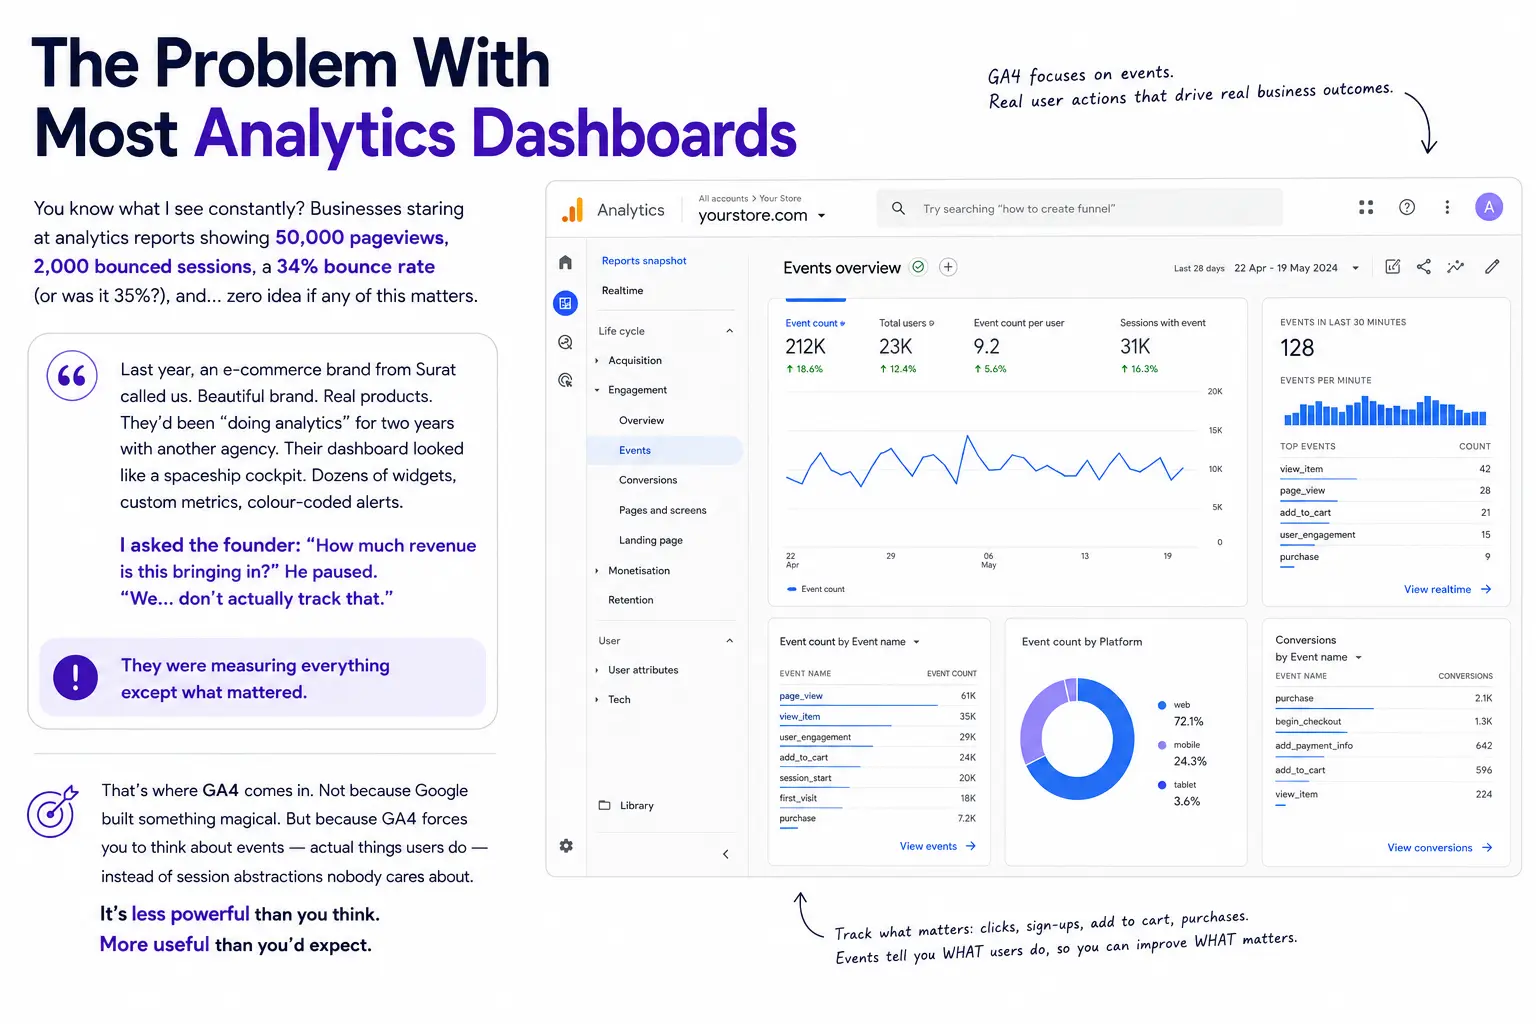
I see this constantly: businesses staring at analytics reports showing 50,000 pageviews, 2,000 bounced sessions, a 34% bounce rate (or was it 35%?), and zero idea if any of it matters.
Take an e-commerce brand that has been “doing analytics” for two years with an agency. Beautiful brand, real products. Their dashboard looks like a spaceship cockpit, with dozens of widgets, custom metrics and colour-coded alerts.
Ask the founder: “How much revenue is this bringing in?” The answer is often a pause, then “We… don’t actually track that.”
They are measuring everything except what matters.
That’s where GA4 comes in. Google did not build something magical. GA4 makes you think about events, the actual things users do, instead of session abstractions nobody cares about. It is less powerful than you think and more useful than you’d expect. If you also run paid campaigns alongside your analytics work, it helps to understand how the two connect. We cover that in our guide on performance marketing frameworks that scale revenue.
GA4 vs Universal Analytics: what actually changed
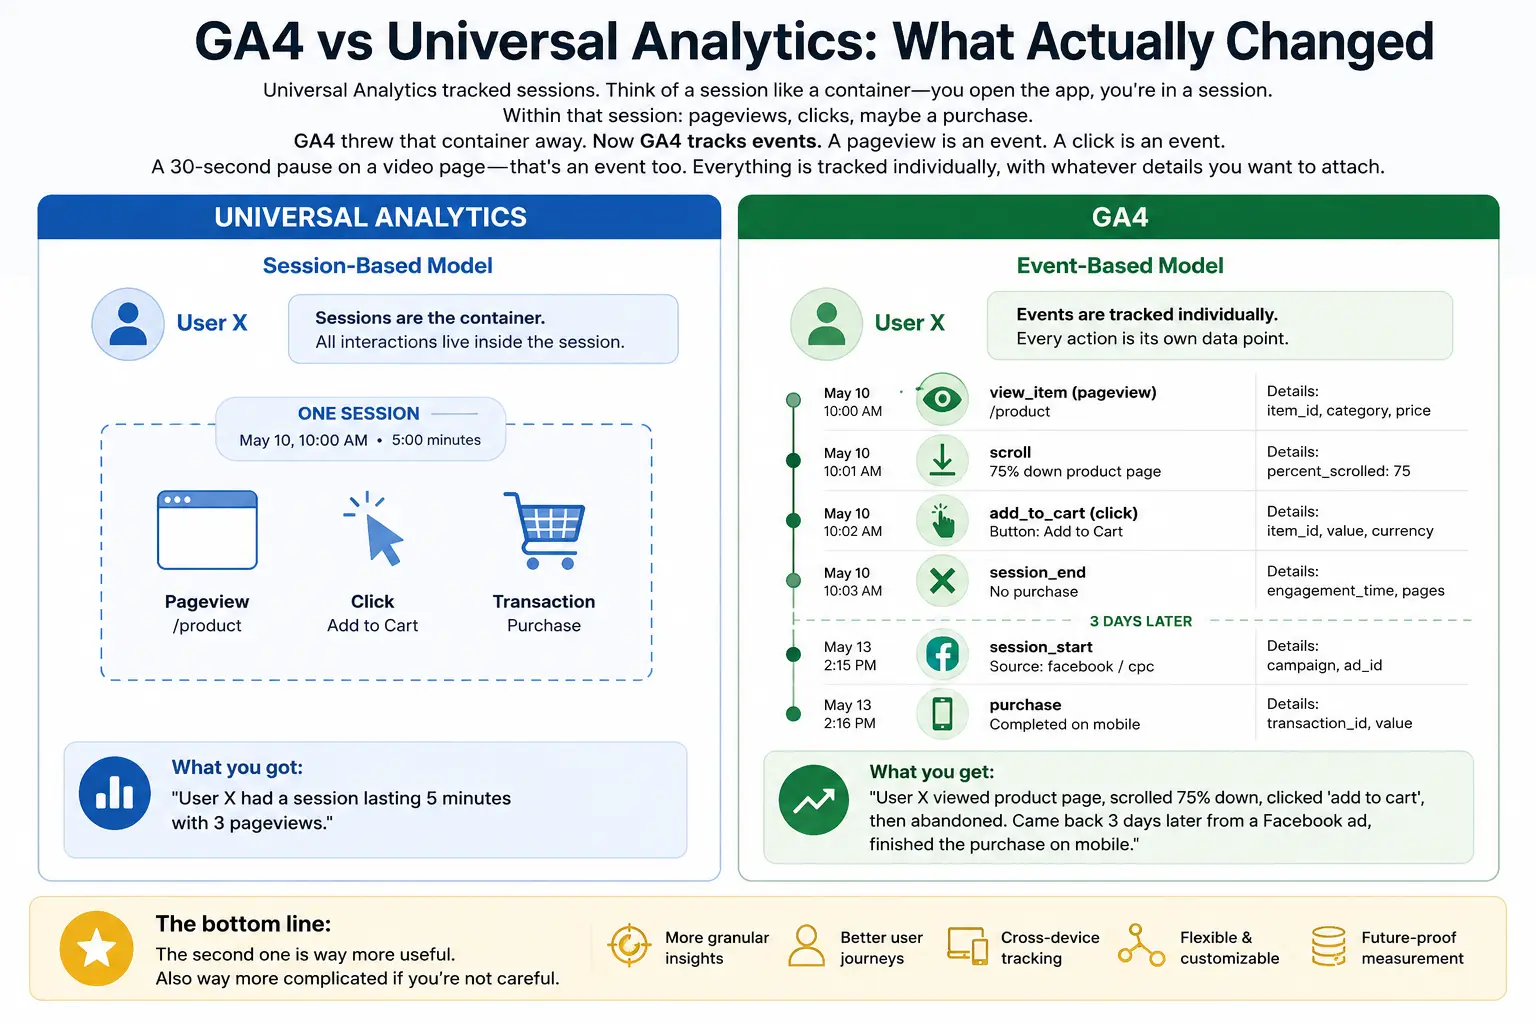
Universal Analytics tracked sessions. Think of a session as a container: you open the app, you’re in a session. Within that session you get pageviews, clicks and maybe a purchase.
GA4 threw that container away and tracks events instead. A pageview is an event. A click is an event. A 30-second pause on a video page is an event too. Everything is tracked individually, with whatever details you want to attach.
That sounds like a small change, but it changes how you read your data.
With sessions, you got: “User X had a session lasting 5 minutes with 3 pageviews.” That was it.
With events, you get: “User X viewed product page, scrolled 75% down, clicked ‘add to cart’, then abandoned. Came back 3 days later from a Facebook ad, finished the purchase on mobile.”
The second one is far more useful. It is also more complicated if you are not careful.
Three things that matter
- GA4 can follow someone from mobile to laptop to tablet without losing the thread. Universal Analytics couldn’t do this well, and it matters for Indian users who research on phones and buy on desktops.
- You are not locked into predefined goals. If you want to track “users who viewed a product, saw a competitor’s name in reviews, but still bought,” you can. Universal Analytics would have needed three custom goals and a prayer.
- GA4 forces you to think about what you are measuring. You can’t just set up GA4 and ignore it. You have to define events and decide what matters. That is one of its best features.
Getting GA4 running: the short version
The setup is a bit tedious, I’ll be honest. But it takes about 30 minutes if you pay attention.
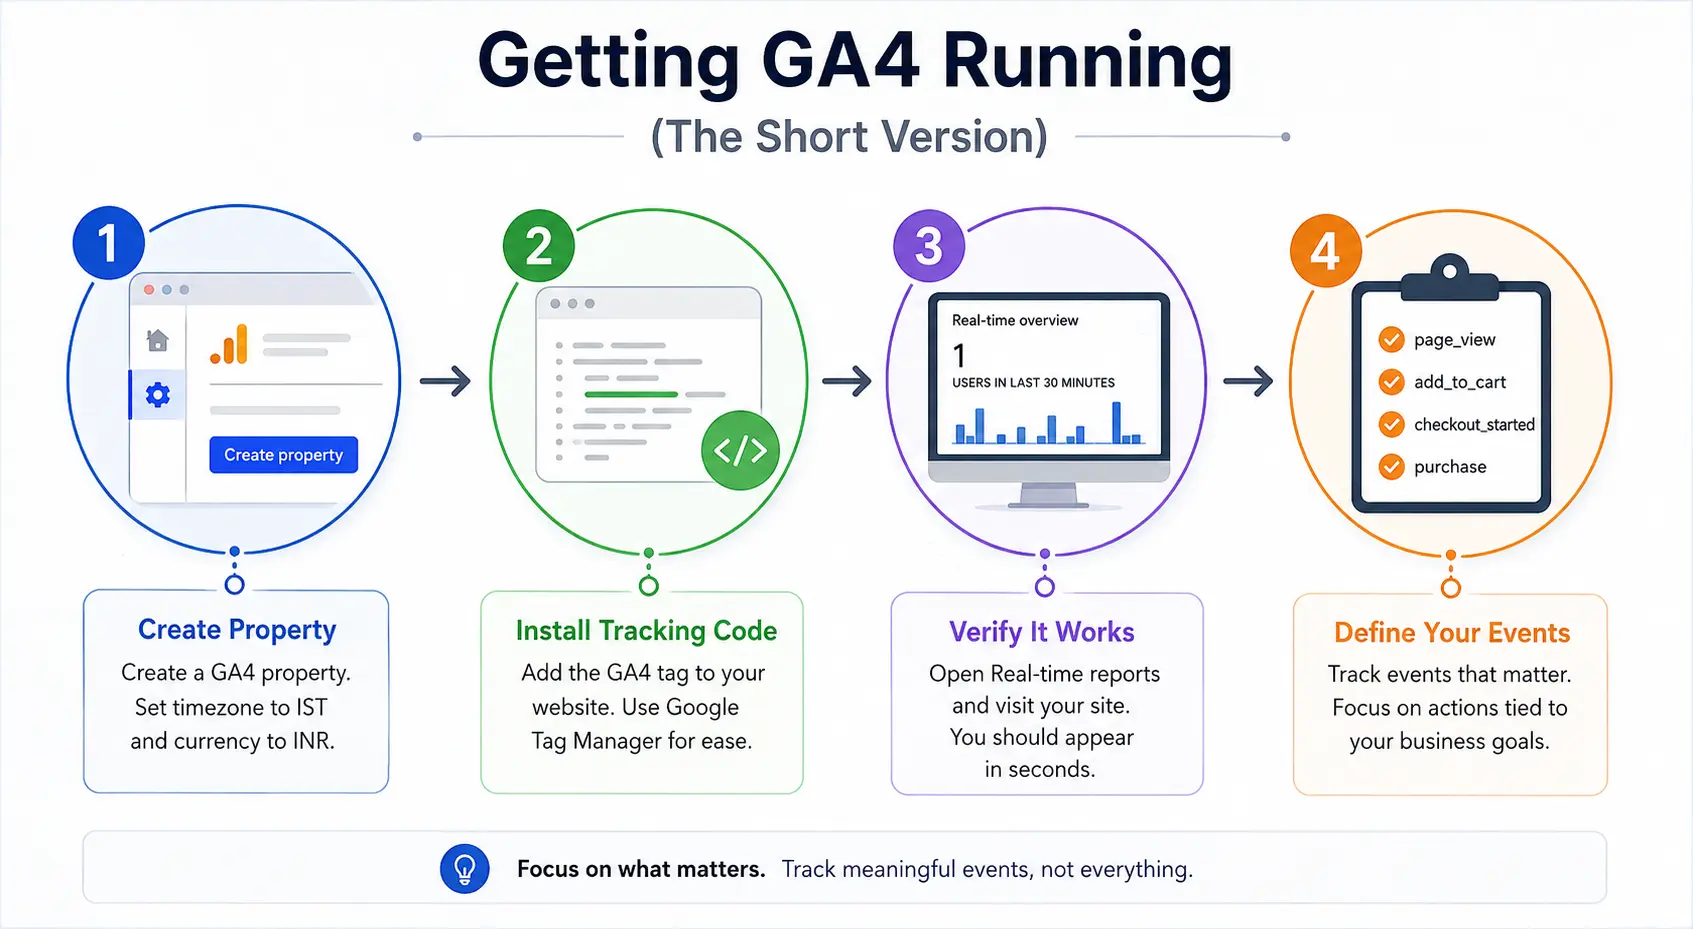
Step 1: Create the property. In the Google Analytics admin panel, click “Create property” and choose GA4. Set the timezone to IST and the currency to INR if you track purchases in rupees. People skip this and then their reports are off by hours.
Step 2: Install the tracking code. Google gives you a snippet. You can paste it on your website if the site is simple, or use Google Tag Manager (GTM). GTM is better, so use GTM.
Step 3: Verify it works. Go to the Real-time reports and visit your site. You should appear in the report within seconds. If you don’t, go back to step 2 and fix it.
Step 4: Define your events. This is where it gets important, because it separates useful analytics from a useless dashboard.
Don’t track everything. Track what you care about. An e-commerce shop should track product view, add_to_cart, checkout started and purchase. A SaaS (software-as-a-service) platform should track signup, trial started, upgraded and cancelled. Each industry is different. Think about your business goal, then work backwards to events.
Once events are configured, you’re mostly done. You will probably adjust them three times before you get them right, which is normal. Everything else is learning to read the reports.
Events and parameters: the building blocks
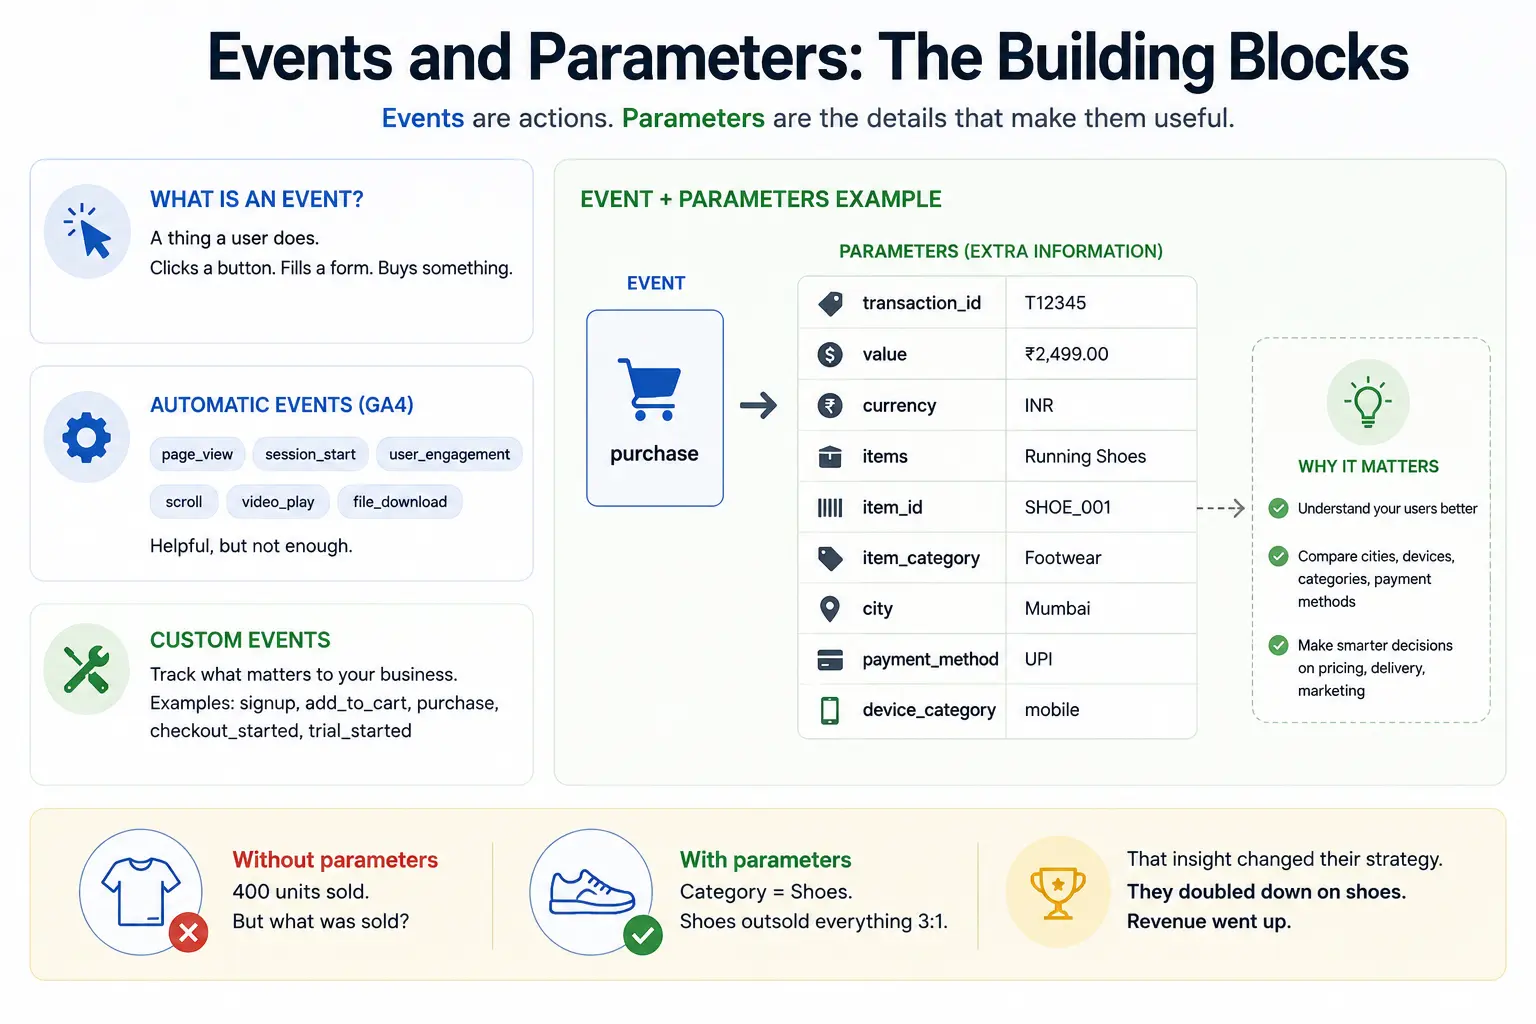
An event is something a user does, such as clicking a button, filling a form, buying something or watching a video.
GA4 comes with some automatic events: page_view (user lands on a page), session_start (first event of the session) and user_engagement (user is still active). You can switch on more, such as scroll events, video_play and file_download.
But automatic events aren’t enough. You need custom events that matter to your business.
That’s where parameters come in. A parameter is extra information about an event. Say someone buys something. The event is “purchase”, and the parameters tell you more: which product, what price, from which city, and using what payment method.
For Indian e-commerce, city and payment method are very useful. You want to know whether Mumbai users are your biggest spenders, or whether Bangalore users prefer UPI. This informs pricing, delivery and ad targeting.
Here is a made-up example. A fashion brand tracks product purchases without tracking product_category. They know 400 units sold, but can’t tell if it was shirts, shoes or something else. Add category as a parameter and they can suddenly see which products sell most, and put their effort there. That is the difference parameters make.
The reports that actually matter
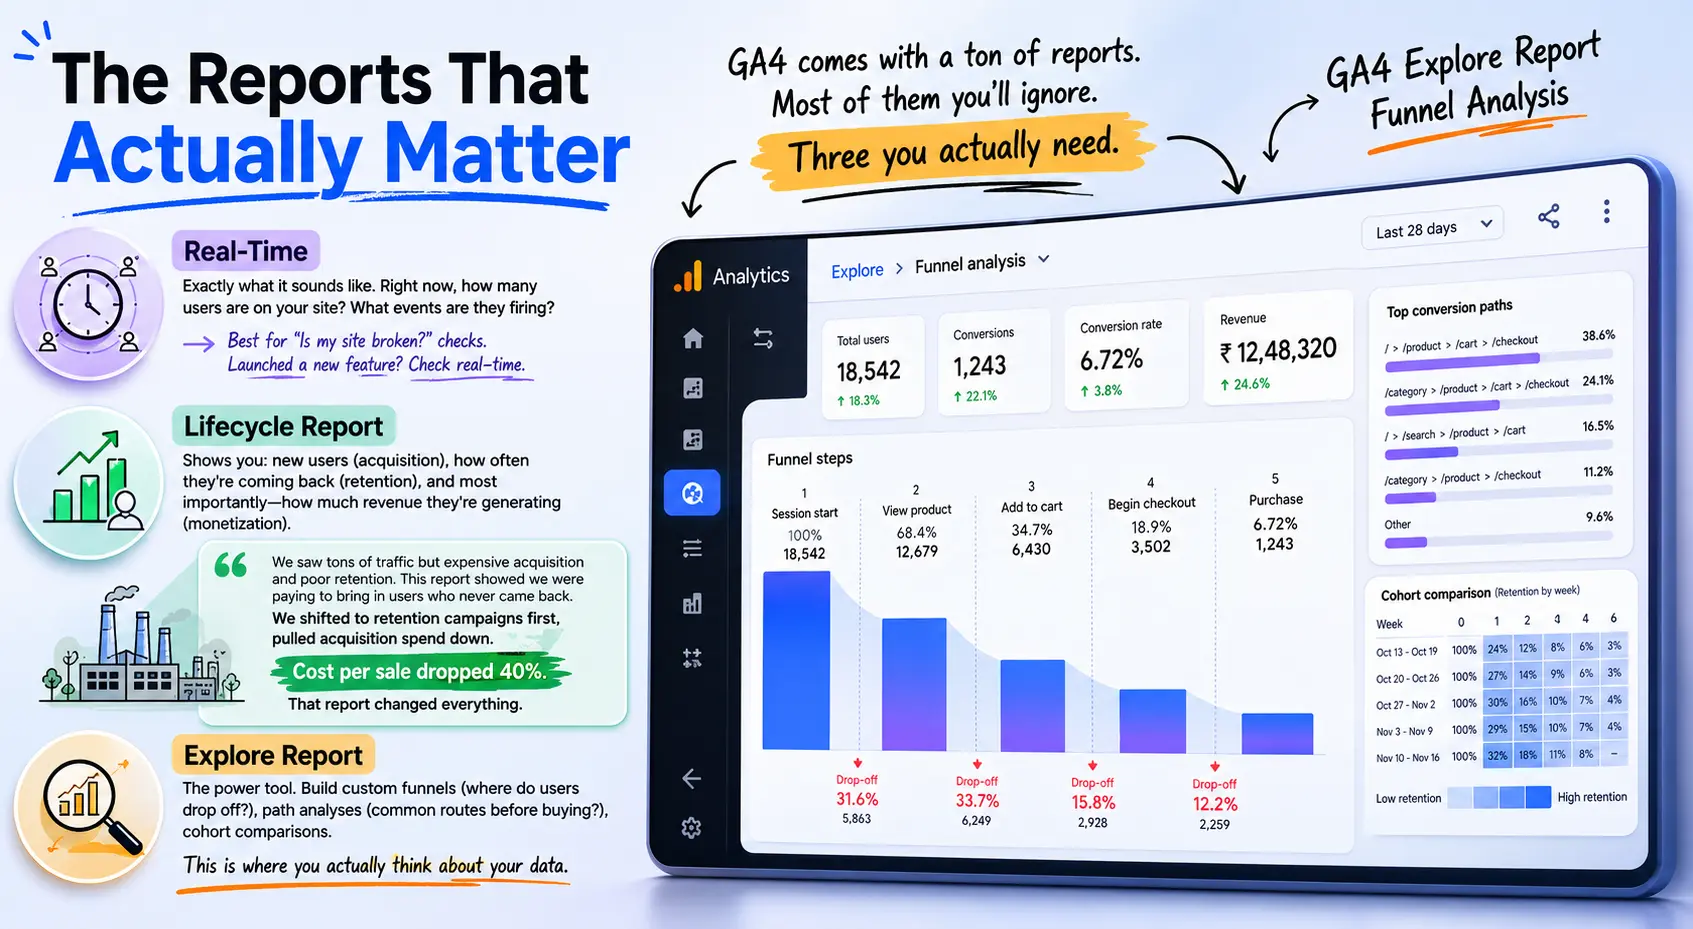
GA4 comes with a ton of reports. Most of them you’ll ignore. Three you actually need.
Real-time
Exactly what it sounds like. Right now, how many users are on your site? What events are they firing? This is less useful for decision-making and more useful for “Is my site broken?” checks. Launched a new feature? Check real-time to see people using it.
Lifecycle report
This one is underrated. It shows new users coming in (acquisition), how often they come back (retention) and, most importantly, how much revenue they generate (monetisation).
Imagine a manufacturing company with a lot of website traffic, but expensive acquisition and poor retention. This report shows straight away that they are spending money to bring in users who never come back. So they shift to retention campaigns first and pull acquisition spend down. This is a made-up example, but it is the kind of insight this report gives you.
Explore report
The power tool. Build custom funnels (how many people drop off at checkout?), path analyses (what’s the most common route people take before buying?), cohort comparisons.
This is where you actually think about your data instead of just staring at it.
Conversions: the only numbers that matter
You can mark any event as a conversion. When you do, GA4 treats it differently. It highlights it in reports, uses it for machine learning and sends it to Google Ads.
So which events should be conversions?
Only the ones that mean something to your business. For e-commerce, a purchase is obvious. For SaaS, it’s signup or subscription_start. For a news site, newsletter_signup. For lead generation, a completed form.
Don’t mark everything. I see businesses with 20+ conversions tracked. That is drowning, and your data becomes noise.
Here is a mistake to avoid. Say a brand sets up 14 different “conversion” events, one at each stage of the buying process. Page view = conversion. Sign up = conversion. First purchase = conversion. When all of them are conversions, none of them mean anything. Start with ROI (return on investment): what actually drives the business?
For most Indian e-commerce brands we work with, there are usually three conversions that matter: first add-to-cart (shows intent), first purchase (shows they actually buy), and repeat purchase (shows they’re a customer, not a one-time fluke).
Audiences: turning data into action
An audience is a group of users. You define the group based on what they did, where they’re from, how much they spend, or anything else you can measure.
Why? Because once you’ve defined an audience, you can send them to Google Ads or Facebook for remarketing. Or you can send them to your email platform for targeted campaigns.
Behaviours that matter:
Abandoned cart is the obvious one. Someone added a product, started checkout, then left. Remarket to them with the exact product they abandoned plus a discount code. This can win back some of the lost revenue.
Demo viewers for SaaS. Showed interest but didn’t sign up. Remarketing angle: extend free trial offer.
High-value users. Spent a lot, bought multiple times. Send them exclusive new product launches before anyone else sees them.
Geography matters too. Tier-2 and Tier-3 city users often have different buying patterns. Price sensitivity is often lower in metros, and product preferences differ in smaller cities. Build audiences and adjust your messaging for each.
Demographics-based audiences are often overrated for e-commerce. We’ve had better luck with behavioural audiences (did they do X?) than demographic ones (are they female?). Try both, because your mileage will vary.
Explorations: when you want to understand what’s happening
This is where GA4 separates from reports. Explorations are custom deep dives. You ask a specific question and GA4 helps you answer it.
Funnel exploration answers “How many people drop off at each stage of checkout?” Set up the funnel (product view → add to cart → checkout start → payment → purchase), see where people leave, and optimise that step. Then repeat.
Path exploration is weirder but useful. It shows the actual path people take before converting. Maybe you think it is product page → checkout. In fact it may be product page → reviews page → product page → customer Q&A → product page → checkout. That knowledge changes how you build the page.
Cohort analysis compares users who signed up in January, April and July. Are they behaving the same way? Are newer users higher-value or lower-value? This shows whether your product is getting better or worse, or whether your marketing has changed.
Most of these features stay unused because they require thinking about your data. It is easier to stare at the default dashboard and pretend you understand things. But the real insights live in explorations.
Connecting GA4 to Google Ads
Most businesses run Google Ads blind. They see clicks and cost, but have no idea if those clicks turn into customers.
Connecting GA4 to Google Ads fixes that. Suddenly you can see, for example, that the keyword “blue sarees size 10” brought in 45 clicks and 3 purchases at 200 rupees per click. Is that good? Only you know your margins. But at least you know the number.
The connection also lets you send GA4 audiences to Google Ads for remarketing. Send the abandoned cart audience we talked about to Google Ads. It is cheap and targeted.
To set it up: GA4 > Admin > Data streams > Select your website stream > Google Ads links > Add your Ads account. Takes 5 minutes. Wait a day for data to sync.
Once it’s connected, look at the “Ads” reports in GA4. Specifically, the “Performance by Conversion” view. If you see a keyword getting clicks but zero conversions, pause it. If you see a keyword making conversions at great margins, increase spend. That is ROI-first marketing.
Privacy and getting DPDP compliant
India passed the DPDP Act (Digital Personal Data Protection). If you’re collecting data on Indian users, you need to follow it.
GA4 makes this easier than the old system. It uses “behavioural modelling”, which means Google works out patterns without tracking individual people. So your data is already somewhat anonymised.
But you still need to:
- Get consent before tracking. Show a banner, let users opt-in (for non-essential data). This is legally required. It’s also good practice.
- Anonymize IP addresses. GA4 has a setting for this. Turn it on.
- Respect Do Not Track signals. Some users don’t want to be tracked, so honour that choice.
- Document what you’re collecting. Users have a right to know. Have a clear privacy policy. Update it regularly.
- This part is dull, but it matters. Indian users increasingly care about privacy. Show them you respect it, because trust helps conversions.
GA4 for Indian businesses: regional insights and multi-device tracking
GA4 helps Indian businesses track user behavior across devices and regions, providing a clearer view of the path to conversion.
- Multi-device tracking
Indian users are mobile-first but not mobile-only. They research on mobile, compare on desktop, and buy on tablet. GA4’s multi-device tracking stitches these journeys.
Enable User-ID feature for logged-in users. Implement Google Signals for cross-device analysis. This shows you the full path to conversion, not just isolated devices.
- Regional insights
India is massive and diverse. Delhi users behave differently than Mumbai users, who behave differently than Bangalore users.
In GA4, create user properties for: City, Tier (Tier-1, Tier-2, Tier-3), Language. Filter reports by these properties. Understand regional demand, pricing sensitivity, and product preferences.
For example, Tier-2 city users might have longer decision cycles (more sessions before purchase). Adjust your nurture strategy accordingly.
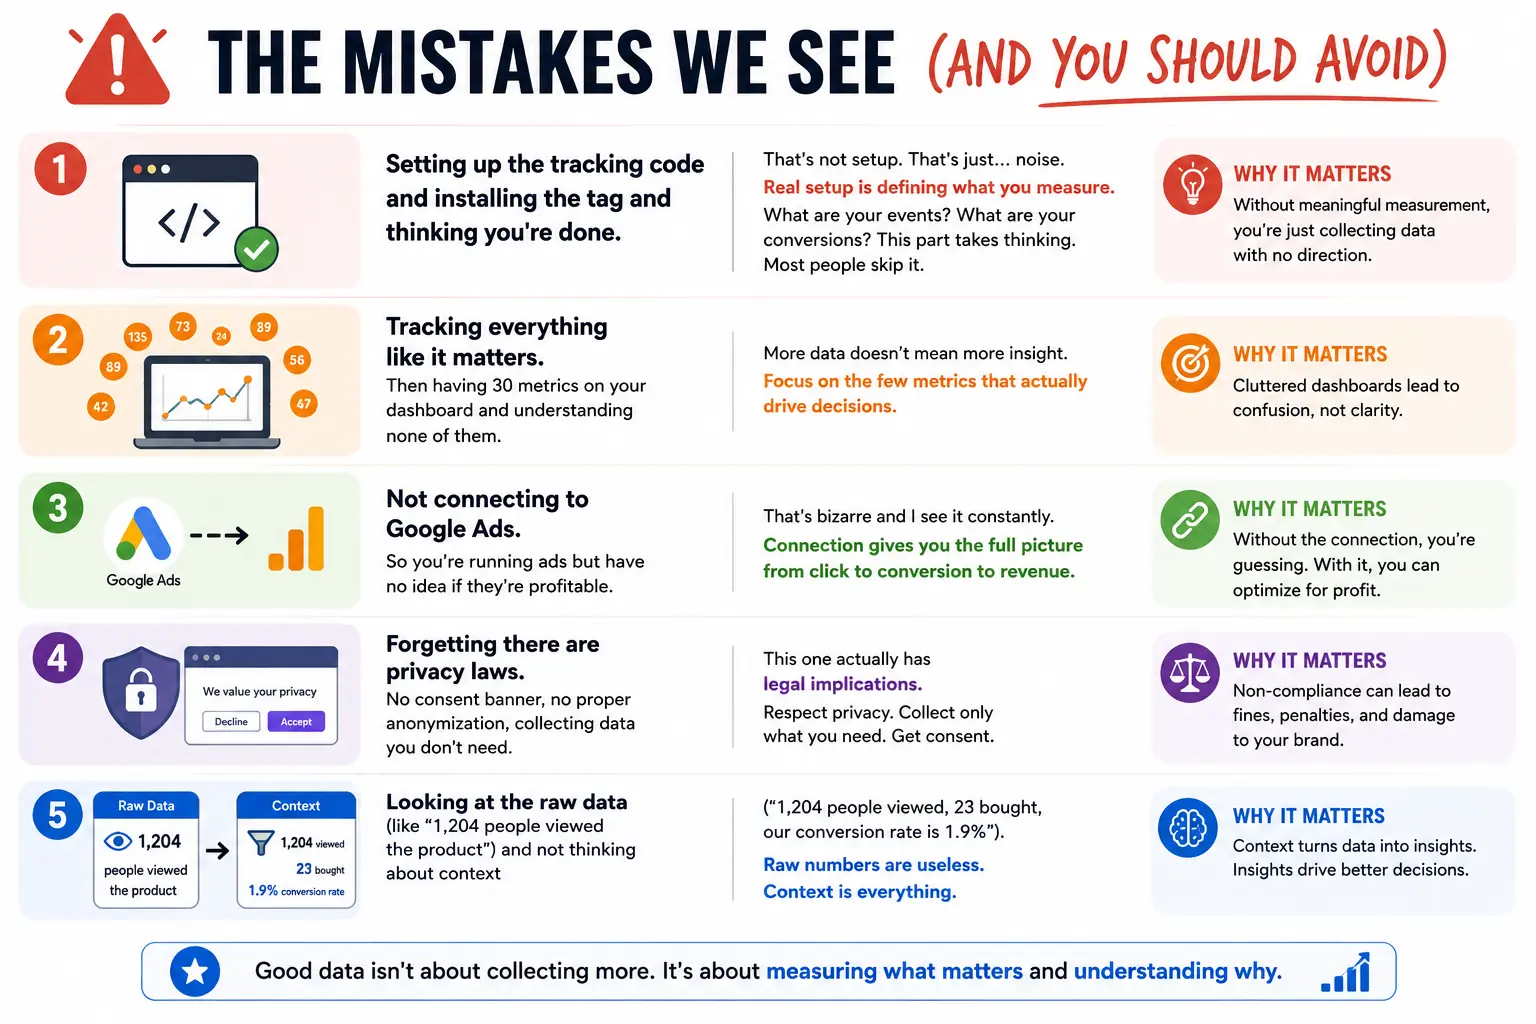
The mistakes we see, and how to avoid them
- Setting up the tracking code and installing the tag and thinking you’re done.
- That is only noise. Real setup is defining what you measure. What are your events? What are your conversions? This part takes thinking, and most people skip it.
- Tracking everything like it matters. Then having 30 metrics on your dashboard and understanding none of them.
- Not connecting to Google Ads. You are running ads with no idea if they are profitable. I see this often.
Forgetting there are privacy laws. No consent banner, no proper anonymization, collecting data you don’t need. This one actually has legal implications.
Looking at the raw data (like “1,204 people viewed the product”) and not thinking about context (“1,204 people viewed, 23 bought, our conversion rate is 1.9%”). Raw numbers alone tell you little. Context is what makes them useful.
The Actual ROI Question
- Does GA4 increase revenue by itself? No. It’s not magic. It’s a tool.
- Does it help you make better decisions that increase revenue? Yes.
You can’t optimise what you don’t measure. GA4 lets you measure properly.
Take a company offering Real Estate Service, with property listings, a decent website and an okay conversion rate. They don’t know which property types convert best, which neighbourhoods get the most enquiries, or which traffic sources lead to sales rather than just clicks.
Set up GA4 to track those specifics and you might find that one type of property converts far better than another. Then you can shift ad spend towards it. GA4 doesn’t make that happen. It shows you where to focus, and that is the real value.
What we actually use GA4 for
We use it to settle arguments with clients.
Client: “More traffic will solve everything.”
GA4: Shows their conversion rate is 0.8%. More traffic won’t help if only 1 in 125 people buy.
Client: “We need to target women aged 25-35.”
GA4: Shows their highest-value customers are men 40-50.
Client: “Paid ads aren’t working.”
GA4: Shows paid ads bring cheaper, better-quality traffic than organic. They just weren’t tracking it properly.
GA4 takes opinion out of the conversation, and that is valuable.
Related reading:
But your competitors who skip GA4 are guessing. They run ads and hope. They optimise pages without knowing what matters to users. They may be growing, but inefficiently.
You don’t have to be like that.
Spend a day setting up GA4. Spend another day defining your events. Then, every week, spend 30 minutes looking at the data. Over time you will make fewer poor decisions, because the data will show you what works.
Build, measure, grow. That is how we work at PromotEdge, and GA4 is the measuring part.
Need help setting up GA4 properly?
We know what to track, what to ignore, and how to turn data into decisions. Let’s talk about your specific needs.